1. Ideawake Knowledgebase
  2. Analytics and Reporting
  3. Add New Gadgets to Your Analytics Dashboard

Add a Pie Chart Gadget to Your Analytics Dashboard

Here's how to add a new pie chart to your analytics dashboard to see a distribution of categories, sources, or anything else you'd like to graph!

Add a Pie Chart Gadget

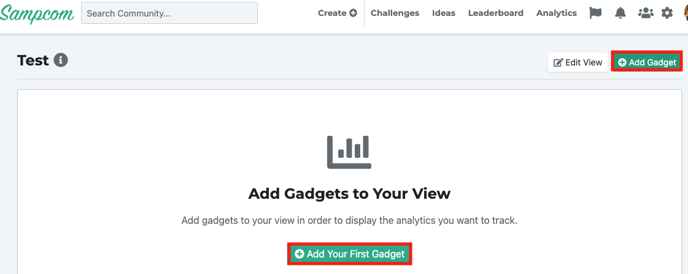
On the analytics dashboard, click on the '+ Add Gadget' button or the '+Add Your First Gadget' button on the page  

Screen Shot 2022-09-21 at 1.10.52 PM

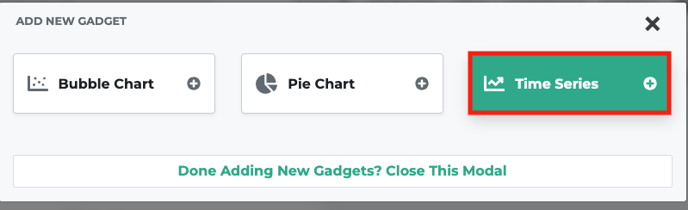
Select the time series gadget

Screen Shot 2022-09-21 at 1.19.24 PM

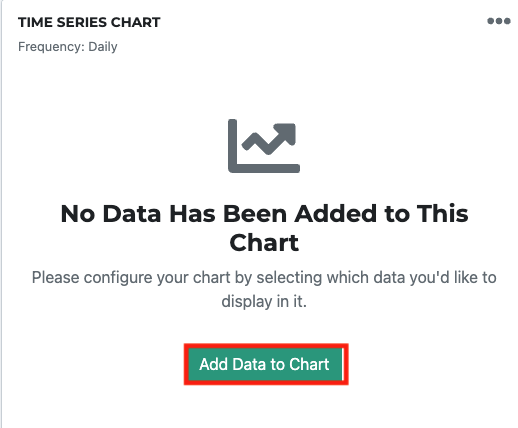
Click on the 'Add Data' Button on your time series gadget

Screen Shot 2022-09-21 at 1.19.46 PM

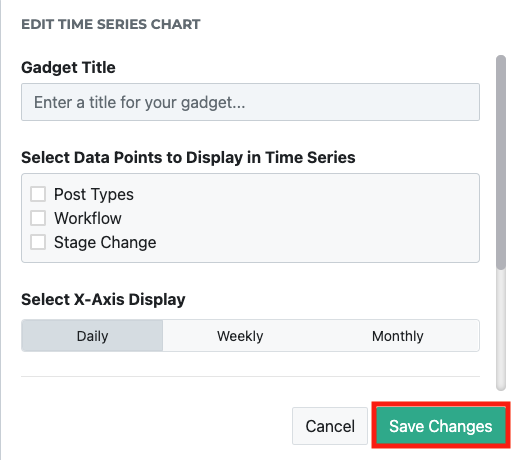
Enter in the desired information and click 'save changes' button

Screen Shot 2022-09-21 at 1.19.51 PM